다변량 자료다변량 자료의 탐색
- 분석하려는 주제가 두 개 이상인 것
- 변수가 두 개인 경우는 이변량 자료
- 이변량 자료 분석이 많음
- 2차원 형태의 배열에 넣어서 분석
- 분석 대상이 되는 주제가 변수

산점도 plot()
이변량 자료의 분포 및 상관관계를 시각적으로 보여줌
변수의 상관관계를 확인할 수 있음

wt<-mtcars$wt
mpg<-mtcars$mpg
plot(wt, mpg,
main="car weight-mpg",
xlab="car weight",
ylab="miles per callon",
col="red",
pch=19)

산점도의 매개변수


포인트의 종류

plot()
2차원 그래프
두 개의 변수에 대한 관계만 나타냄
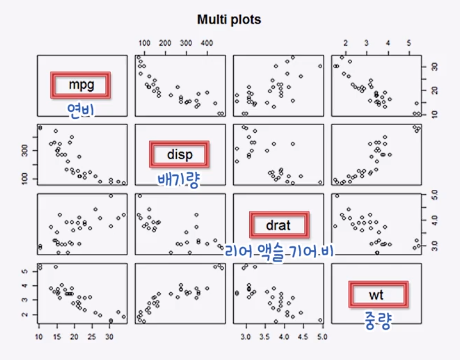
pairs()
여러 변수들 사이의 상관관계를 한꺼번에 나타냄

vars<-c("mpg","disp","drat","wt")
target<-mtcars[,vars]
pairs(target,
main="Multi plots")
그룹별로 다른 컬러 및 모양의 포인트 사용

iris.2<-iris[,3:4]
point<-as.numeric(iris$Species)
color<-c("red","green","blue")
plot(iris.2,
main="Iris plot",
pch=c(point),
col=color[point])

'공부와 공부와 공부 > R' 카테고리의 다른 글
| 5-3 다변량 자료의 탐색 R 선그래프 plot() lines() (0) | 2019.05.19 |
|---|---|
| 5-2 다변량 자료의 탐색 R상관분석, 상관계수 plot(), cor(), cbind(), rbinds(), lm() (0) | 2019.05.19 |
| 4-4 문자열 함수 Paste(), Substr(), nchar(), gstr() (0) | 2019.05.12 |
| 4-3 R을 이용해 만드는 일변량 양적 자료 그래프 Mean(), diff(), sd(), range(), boxplot(), hist(), stem() (0) | 2019.05.09 |
| R 그래프를 만드는 데 뜨는 에러 Error in RStudioGD() (0) | 2019.05.08 |


